Monday 29 June 2020
Airline Credit Profile: China Southern’s opportunities and threats in the post Covid-19 world

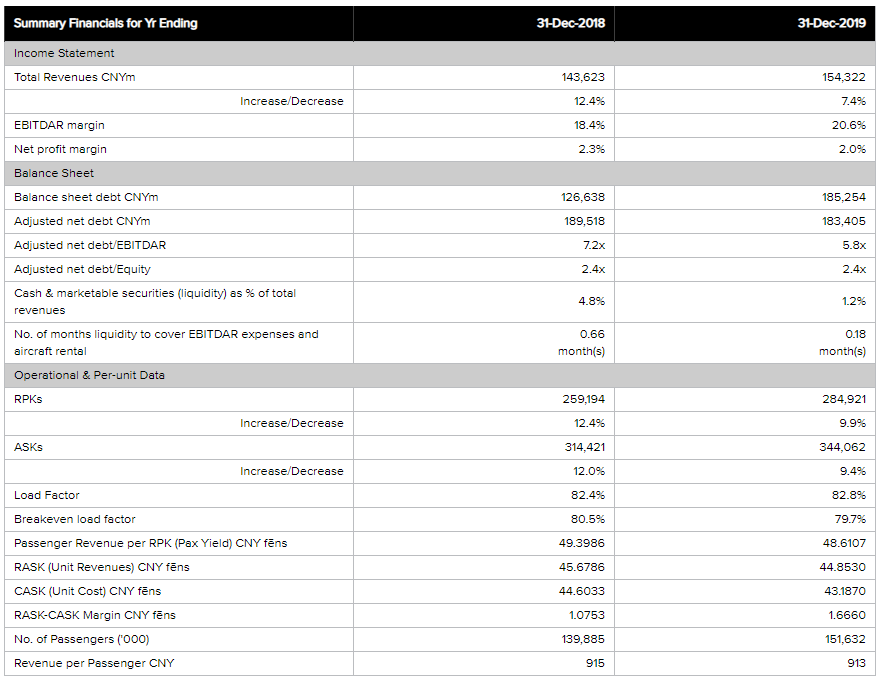
In this week’s airline credit profile, Ishka highlights some of the key aspects of China Southern’s management of the coronavirus crisis and the main opportunities and threats to the airline’s prospects in the post-Covid-19 world.
With China being the first country to be impacted by the coronavirus crisis, the country’s airlines were also the hardest hit in Q1 2020. China Southern reported an operating loss of RMB7.7 billion (US$1.1 billion) in its first three months of 2020, compared to an operating profit of RMB3.55 billion (US$500 million) in Q1 2019.
On the other hand, being also the first to emerge on the other side, there are signs of some nascent recovery. Chinese airlines collectively reported transporting about 25.83 million passengers in May, up from 16.72 million passengers in April compared to 15.13 million in March.
The Ishka View
Although demand levels have improved month-on-month since the peak of lockdowns in February, load factors still remain at least 15 percentage points lower (May figures for China Southern) than at the same point in 2019. Additionally, airlines will also face challenges from international travel restrictions and the prospect of a second wave which could disrupt operations at short notice. Positively, the presence of a large domestic market will be of huge advantage to local airlines during the recovery phase post-Covid-19. And most importantly, as a critical state-owned enterprise, China Southern benefits from the implicit backing of the Chinese government.
This is an excerpt from the airline credit profile on China Southern. Email team@ishkaglobal.com to request your full complimentary China Southern Airline Credit Profile from Ishka to get the complete picture on its handling of the coronavirus crisis and the main opportunities and threats to the airline’s prospects in the post Covid-19 world.
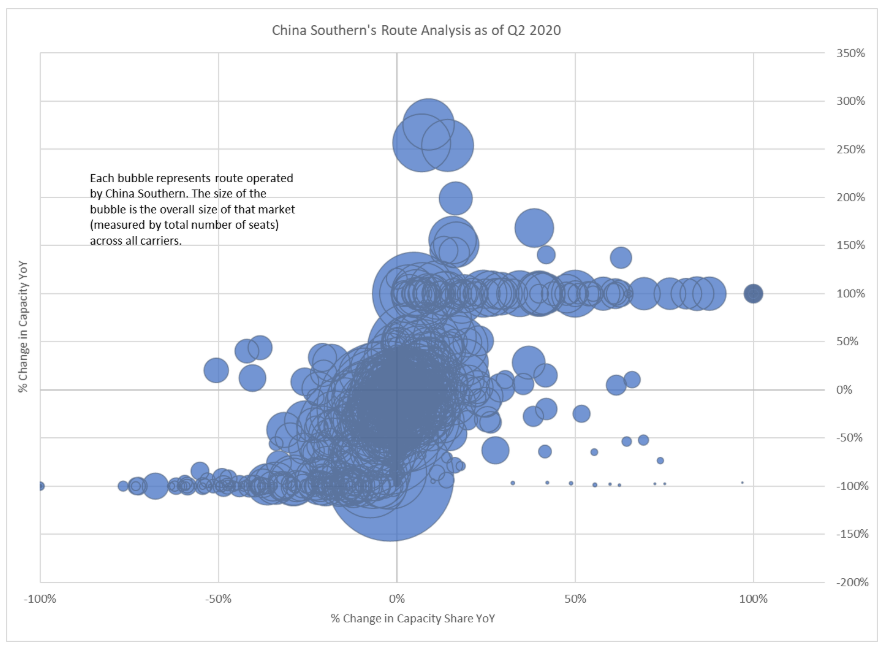
Route Network Analysis
Source: OAG and Ishka Calculations Note: Some outlier market segments have been adjusted. Indicator of bubble size/market size - The largest bubbles represent around 1,000,000 seats, medium-sized bubbles are around 500,000 seats and the smaller ones are less than 100,000 seats. Seat counts are for the quarter – Q2 2020. The above chart reflects capacity situation for Q2 2020 as of the week of 1st June. Due to the current volatile nature of the market, airlines are actively managing capacity only a week or two in advance and adjusting schedules on a weekly basis.


Sign in to post a comment. If you don't have an account register here.