In this joint report, Rob Neale, Chief Product Officer at PACE, and Eduardo Mariz, Senior Analyst and Sustainability Lead at Ishka, examine major lessor portfolios using Impact’s* decarbonisation milestone methodology. Ulrike Ziegler, president of Impact, Philipp Goedeking, co-head of Impact's science workstream and board member of Impact, and Thomas Conlon, co-head of Impact’s science workstream, also contributed to this report.
Aircraft portfolio emissions metrics have had a rocky four years, with absolute emissions dropping for virtually all airlines with the arrival of the Covid-19 pandemic before oscillating through lockdowns, fleet changes, and, in some cases, deeper restructurings. For lessors, whose portfolios largely mirror world traffic trends, 2023 was a turning point: revenue passenger growth exceeded traffic growth for the first time since 2019.
This turn of the tide is what Impact’s milestones consider relative decoupling: when CO2 emissions (in this case measured on an intensity basis) grow slower than their associated capacity. For a more thorough understanding, see Ishka SAVi report: ‘Understanding Impact’s milestone concept for aviation sustainable finance’. This analysis, using data powered by PACE, examines nine of the largest leasing firms and how their portfolio emissions metrics have evolved since 2020.
A look at nine major lessors
Data disclaimer: The portfolio data for each lessor includes lessor-owned aircraft (not managed) and is based on CH Aviation fleet data, reflecting lessor fleet ownership in each year (i.e. it does not apply historical emissions metrics to their current fleet retrospectively). In the case of AerCap and SMBC Aviation Capital, the portfolios of GECAS (acquisition completed by AerCap in 2021) and Goshawk (acquisition completed by SMBC Aviation Capital in 2022) have also been included.
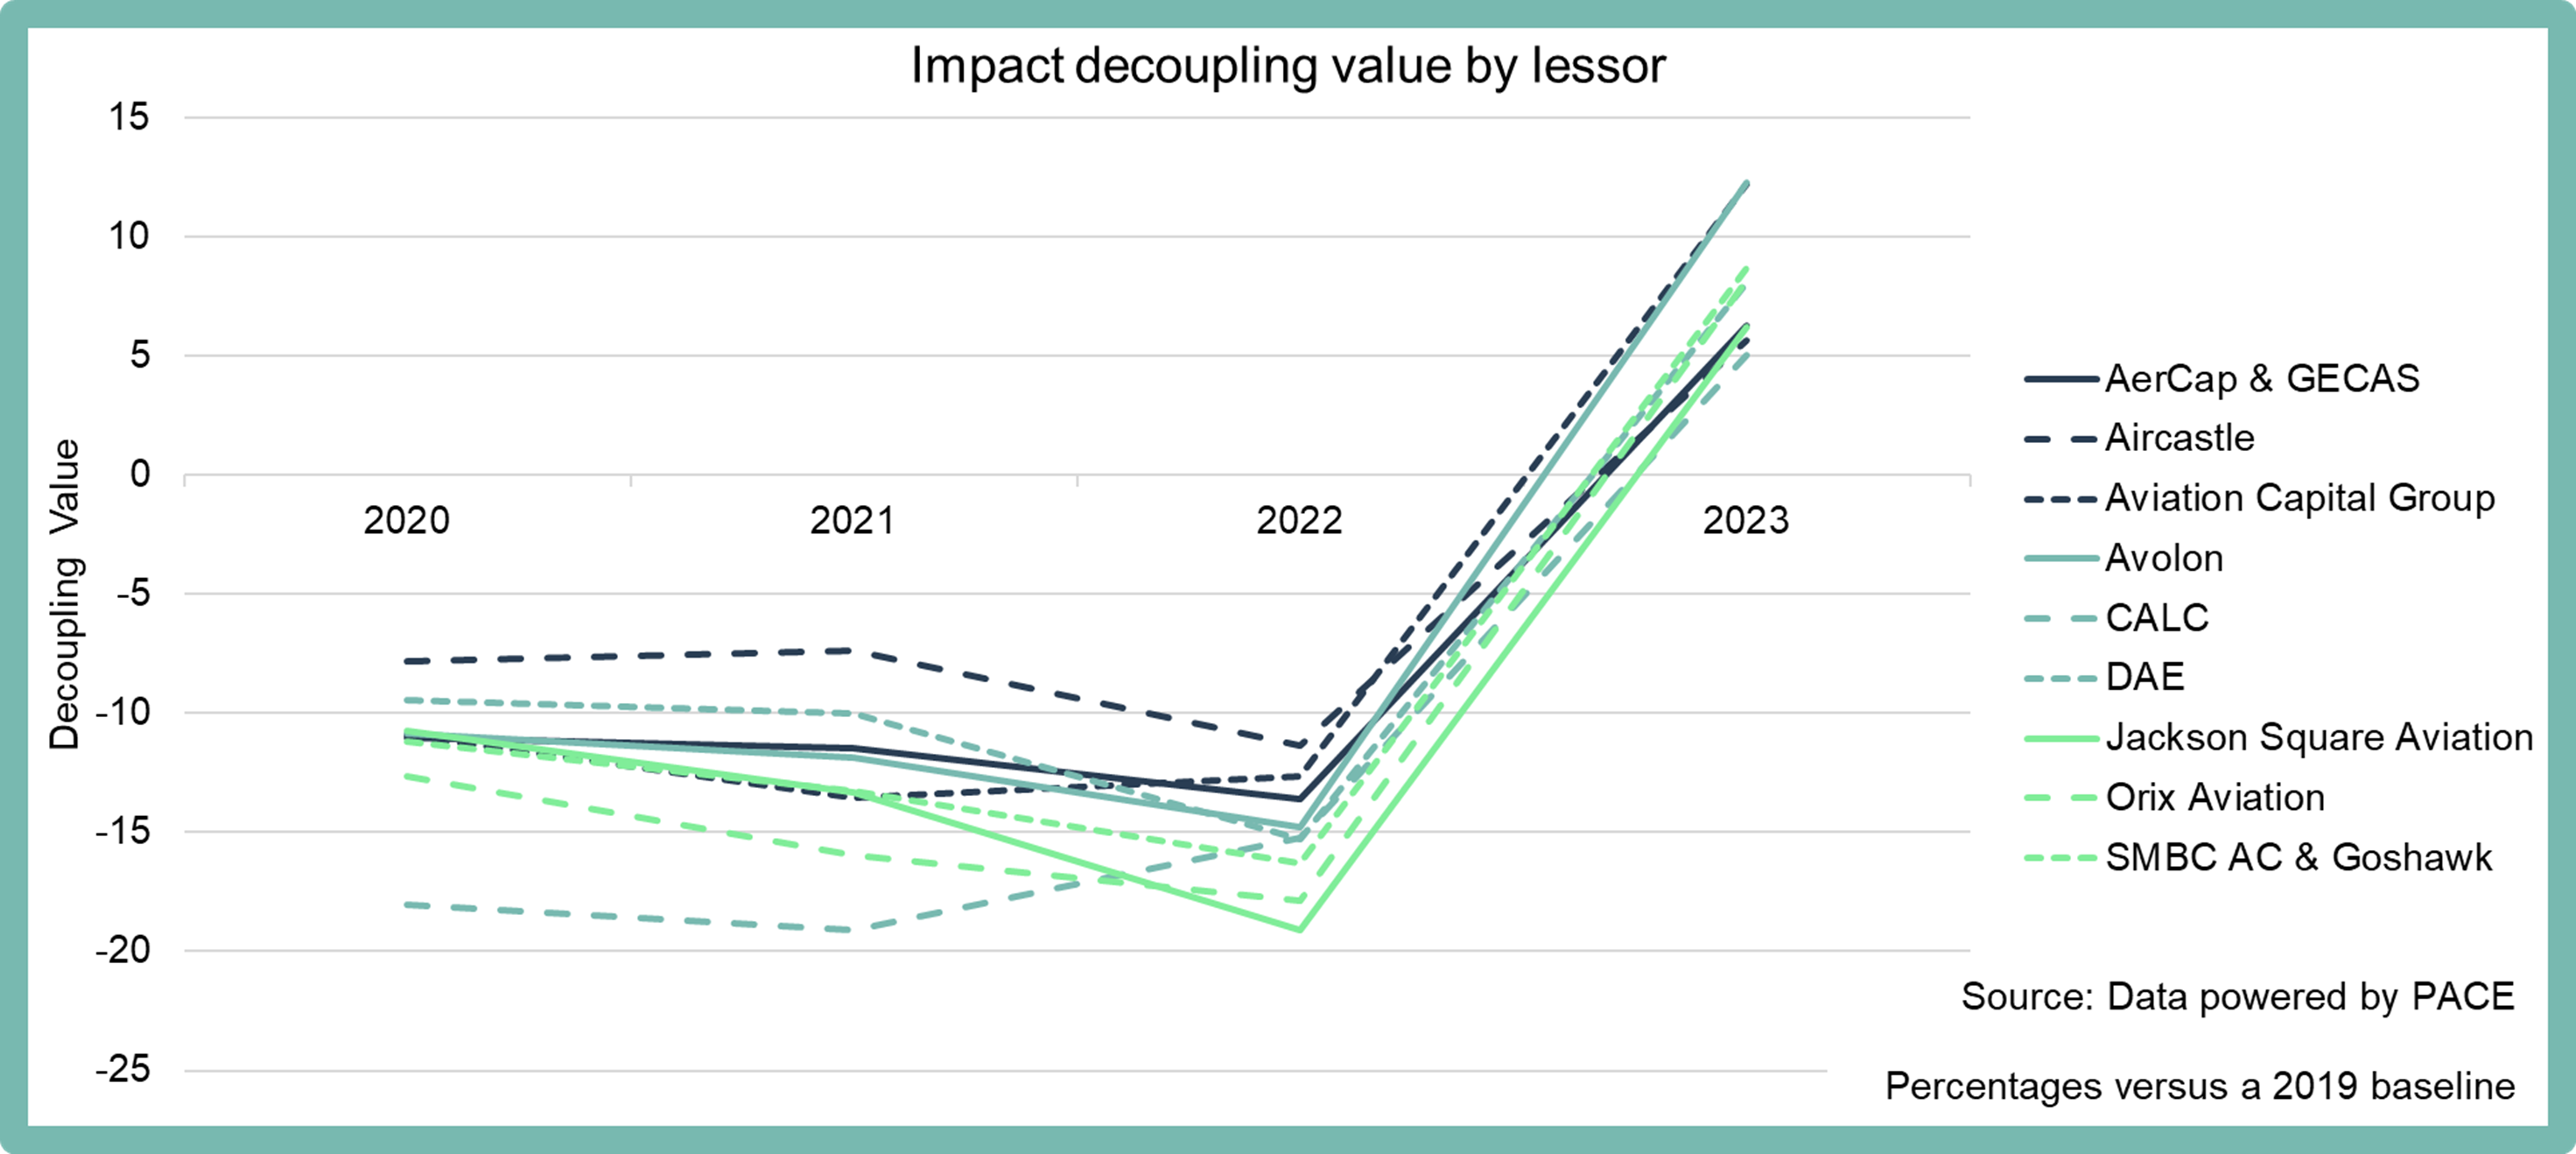 Note: The decoupling value expresses the percentage change difference between RPK and absolute CO2 emissions versus a 2019 baseline.
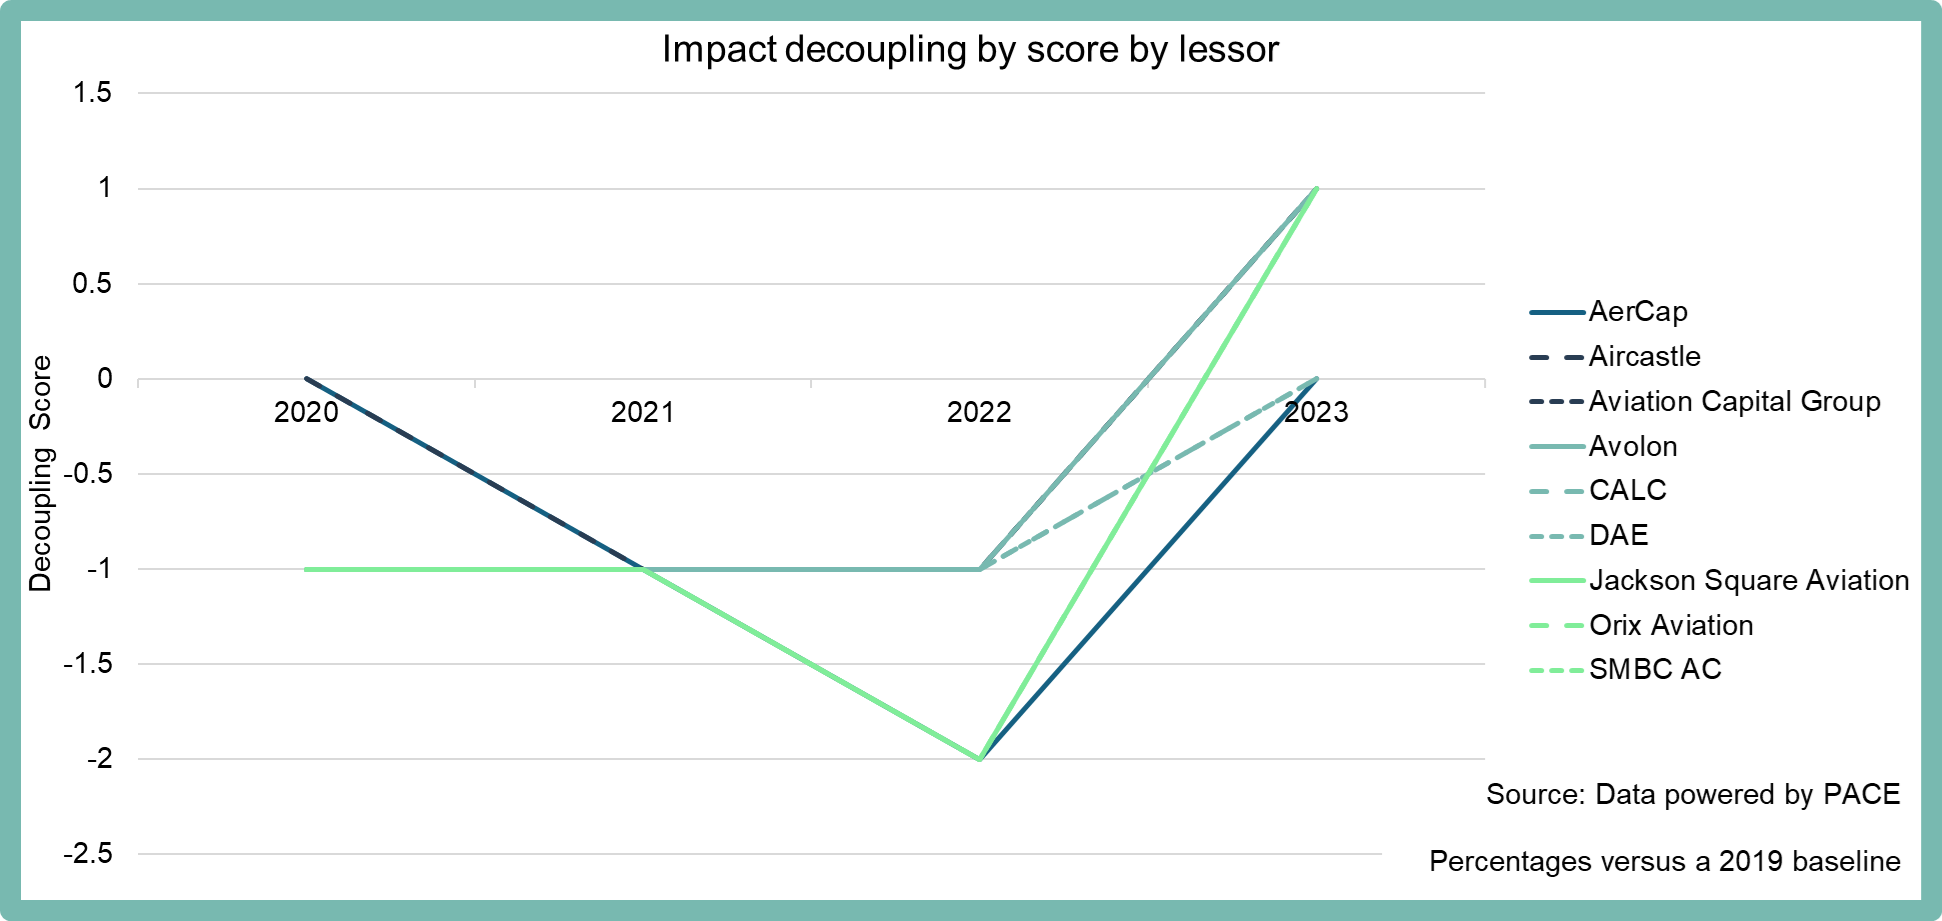 Note: The decoupling score is derived from the position of each lessor and each year in a scoring matrix. See page eight of Impact’s milestone paper for more details. In the chart above some of the scores overlap. Scores for each lessor in the respective 2020, 2021, 2022 and 2023 years are: AerCap (0, -1, -2, 0), Aircastle (0, -1, -1, 1), Aviation Capital Group (-1, -1, -1, 1), Avolon (-1, -1, -1, 1), CALC (-1, -1, -1, 0), DAE (-1, -1, -1, 0), Jackson Square Aviation (-1, -1, -2, 1), Orix Aviation (-1, -1, -2, 1), and SMBC AC (-1, -1, -2, 1).
The first of the charts highlights the decoupling (absolute emissions relative to growth in capacity) over the past four years. Lessors for which the decoupling curve is negative (all analysed lessors from 2020 to 2022) saw a greater variation in emissions than traffic versus a 2019 baseline (i.e. deploying aircraft less efficiently or, in the case of that three-year period, airlines adding capacity during times of depressed demand).
On the other hand, lessors achieving positive decoupling (all analysed lessors in 2023) saw lessees grow traffic (paying passengers, or revenue per passenger kilometre) faster than they grew emissions. This would have been achieved through improvements in load factors or the deployment of more efficient aircraft.
For more details on each lessor, download PACE’s presentation Impact Framework: Lessor Portfolios
What places and aircraft tell of the recovery
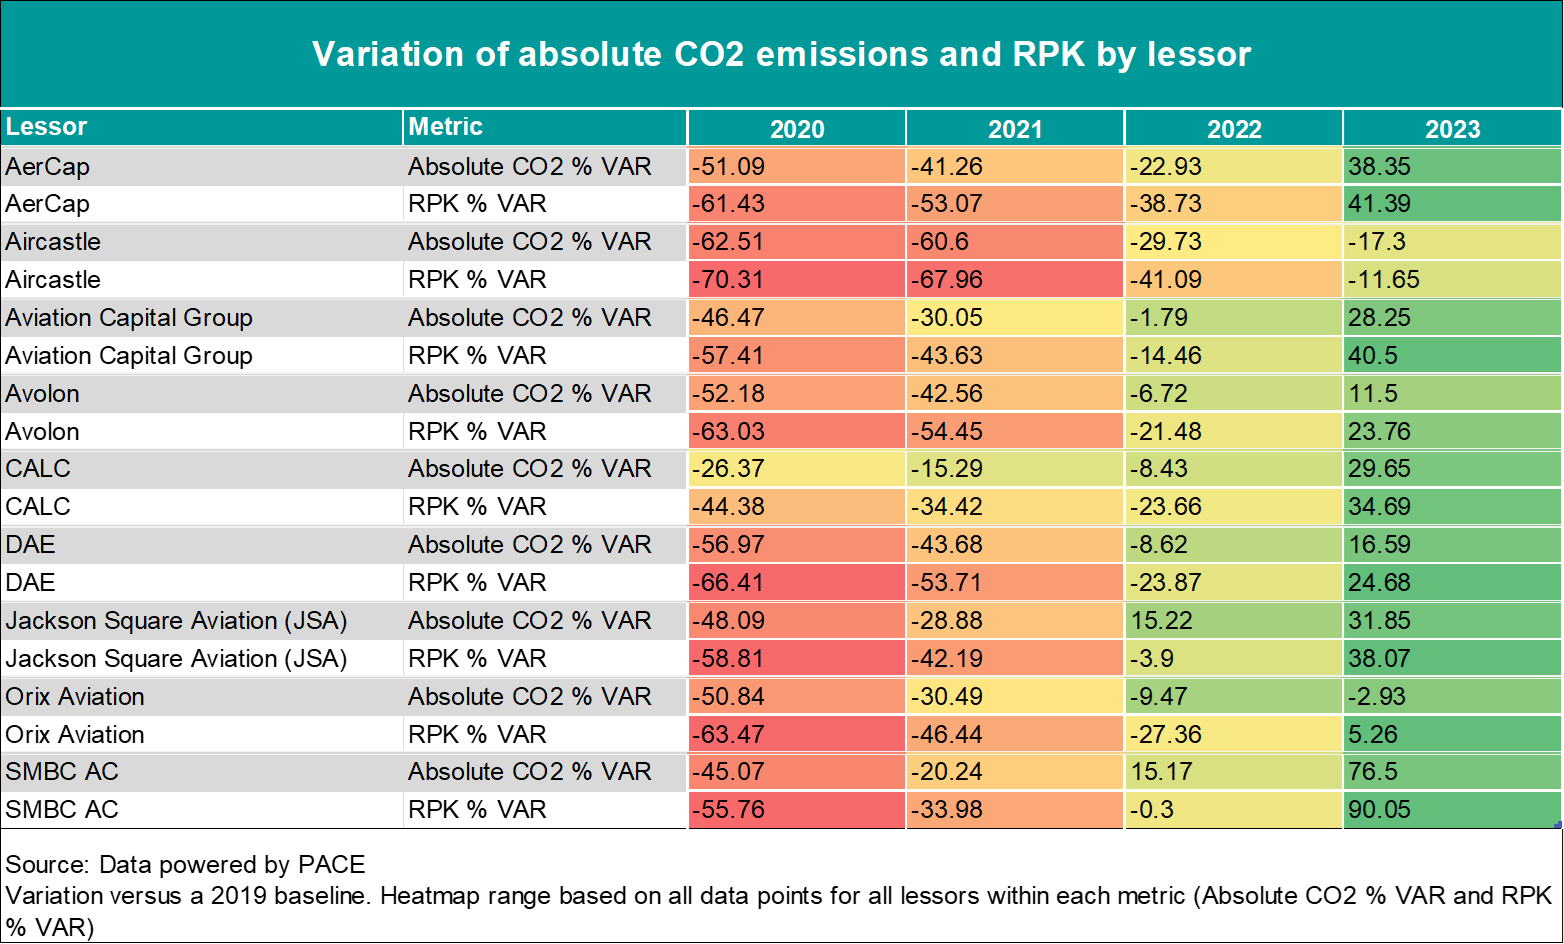 Note: A higher variation for RPK and absolute emissions shown for AerCap and SMBC Aviation Capital in 2023 reflect portfolio acquisitions after their 2019 baseline.
Several factors likely influenced the recovery to positive decoupling for the analysed leasing firms.
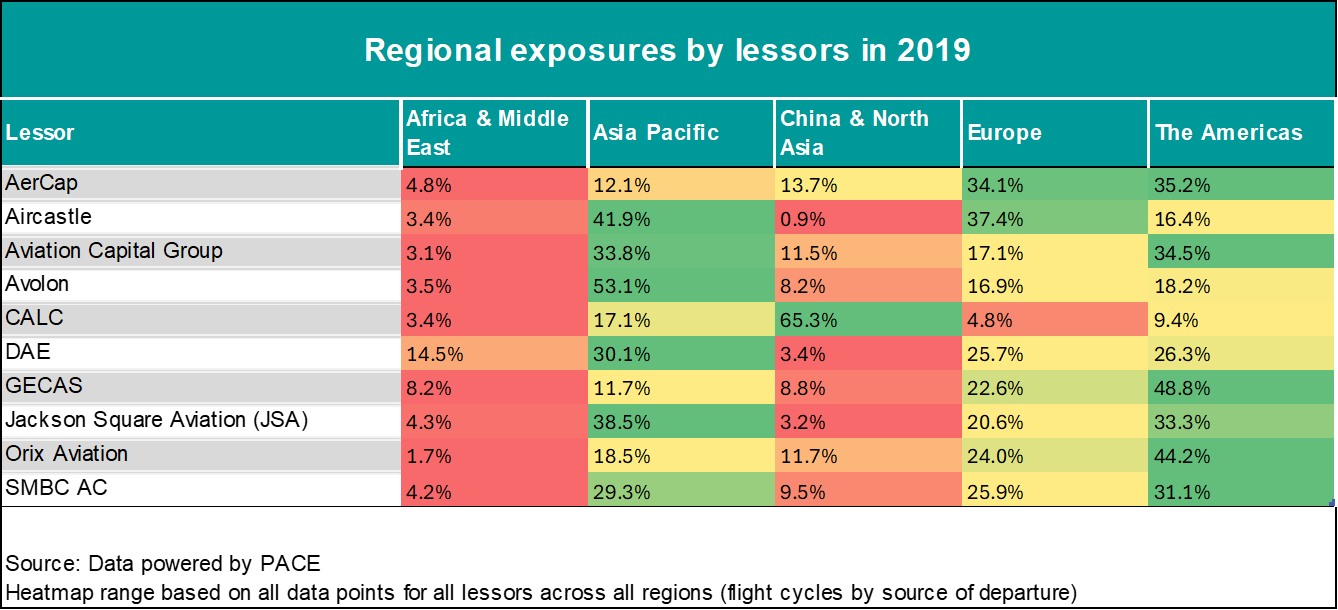
The first is regional exposures, which are more accentuated for certain lessors versus others. Measured as a percentage of all flight departures in 2019, most lessors have a distribution of less than 40% per region, but there are exceptions. For CALC, 65% of all departures in that year correspond to China and North Asia countries, a market (China in particular) where domestic traffic remained resilient early in the pandemic thanks to bubble approaches, but one that was also slower to recover at the tail end of the pandemic. CALC’s absolute emissions (a proxy for capacity) appear to match this trend.
Another is the split between widebody and single-aisle aircraft, as long-haul international traffic was, on average, slower to recover. Lessors like Avolon, DAE or AerCap (including GECAS, now merged into AerCap) had over 15% widebodies in their portfolio by active aircraft count in 2020. On the other hand, SMBC Aviation Capital and Aviation Capital Group (ACG) had portfolios consisting of 94% and 96% narrowbody aircraft – and, partly as a result, saw faster recovery of absolute CO2 emissions (i.e. capacity) in 2022.
The role of re-fleeting
Ultimately, aircraft composition changes in the analysed portfolios are what allowed lessors to achieve positive decoupling at the end of the analysed period.
A look through some of the lessors’ sustainability reports gives a rough idea of the amount of fleet renewal taking place – or at the very least, growth in proportion of newer aircraft. AerCap had 58% new-technology aircraft as of the end of 2019 but that percentage had jumped to 66% in late 2022 and is expected to become 75% by 2024 (the lessor’s target). A similar shift towards new-technology can be seen in several other platforms, with new-tech aircraft delivering 10% to 20% lower emissions than the aircraft they are replacing.
“Re-fleeting is necessary to achieve improvements within the realm of relative decoupling, but it is clearly insufficient to get anywhere near to absolute decoupling,” comments Philipp Goedeking, board member of Impact and co-head of Impact’s science workstream.
The ultimate objective: Absolute decoupling
The positive scores achieved in 2023 by the lessors included in this assessment mark a beginning, though still distant from the ultimate objective. Relatively decoupling (as shown by most lessors) is achievable through upgauging via newer technology re-fleeting (e.g. a one-for-one Airbus A321neo replacement of an A320), but in the long term absolute decoupling will also require a higher deployment of Sustainable Aviation Fuels (SAF) or the introduction of lower and zero-emission propulsion technologies. The end goal is for airlines and lessor portfolios to achieve absolute decoupling: declining absolute emissions even as capacity grows.
“We need to move soon, now, otherwise it will be too late,” comments Goedeking in reference to a need for more investment into the SAF scale-up as well as other fleet and route optimisation measures. “Short term investments are required for long-term successes,” adds Thomas Conlon, a UCD School of Business professor who co-heads Impact’s science workstream.
The Ishka View
The simple arithmetic of increased fuel efficiency with every new generation of aircraft means relative decoupling is nothing new. However, for the leasing sector in particular, the increase in market share across new aircraft delivery financing (via orderbook or sale/leaseback, versus aircraft owned by airlines at delivery) means lessor portfolios that prioritise new aircraft should achieve relative decoupling with comparative ease.
At the same time, this presents limitations in the medium term. Many of the large lessors’ fleets already consist of half or more latest-technology aircraft, and with the two largest OEMs not expected to launch new or re-engined aircraft until the mid-2030s, re-fleeting will soon cease to be the silver bullet solution to emissions intensity reductions. It is also worth noting that Impact’s milestone concept freezes relative decoupling rewards (or points) beyond 2030. At that point, SAF or carbon capture will need to be leveraged if an airline or lessor wishes to continue growing whilst continuing to achieve decoupling points.
Another lesson that can be derived from this analysis is that Impact’s decoupling methodology can withstand black swan events without leading to inflated rewards or penalties. Although not to the same scale, Impact notes that its milestones paper used two airline emissions trajectories since 2008 as an example, a period that would have covered the aftereffects of the global financial crisis (see page 12 of Impact’s milesones paper).
This is a joint article by Ishka and PACE with input from Impact. To better understand how emissions intensity and other emissions metrics can be analysed please contact the PACE team at customersuccess@pace-esg.com . For questions on Impact’s milestone concept, please contact info@impact-on-sustainable-aviation.org
Join Rob, Eduardo and Impact board member Jean Chedeville at a briefing covering the findings of this report during the Ishka Aviation Finance Festival conference in Dublin on 14th May.
* Ishka is a founding member of Impact on Sustainable Aviation. For more information on Impact (Initiative to Measure and Promote Aviation’s Carbon-free Transition e. V.), please visit: impact-on-sustainable-aviation.org


