Wednesday 6 March 2024

How can lessors help unlock emissions intensity reductions from the current fleet?

In this joint report, Rob Neale, Chief Product Officer at PACE, and Eduardo Mariz, Senior Analyst and Sustainability Lead at Ishka, examine airline sub-fleets with emission intensity disparities.
Quiet enjoyment and non-discrimination have long been tenets of aircraft lease clauses, but with OEM new deliveries running behind schedule and a price premium for SAF, is there a case to be made for lessors and asset managers to influence how airlines operate their aircraft in the name of lowering a portfolio’s emissions intensity for both parties? In this exploratory analysis, PACE and Ishka examine airline sub-fleets with emission intensity disparities to ponder whether aircraft owners should encourage (or discourage) the most inefficient uses.
Batik Air Malaysia’s 737 MAX 8s and the ‘Australia factor’
One of the major benefits of the latest-technology narrowbodies is their range versatility from short to longer medium-haul flights. One of the best examples is Batik Air Malaysia, the full-service Malaysian subsidiary airline of Lion Air Group. From its two Kuala Lumpur hubs, Batik Air Malaysia operates 20 Boeing 737 MAX 8s with a medium-dense configuration of 180 seats and near-identical load factors between aircraft.
In 2022, Batik Air Malaysia’s MAX 8 fleet delivered median CO2 intensity of 65.83 CO2(gm)/RPK, below the market average of 73.5 CO2(gm)/RPK for the aircraft type. However, this headline figure hides important disparities. Of the 20 aircraft, nine delivered lower emissions intensity (going as low as 63.46 CO2(gm)/RPK) while six delivered above-market averages (from 78.40 CO2(gm)/RPK to 87.8 CO2(gm)/RPK).
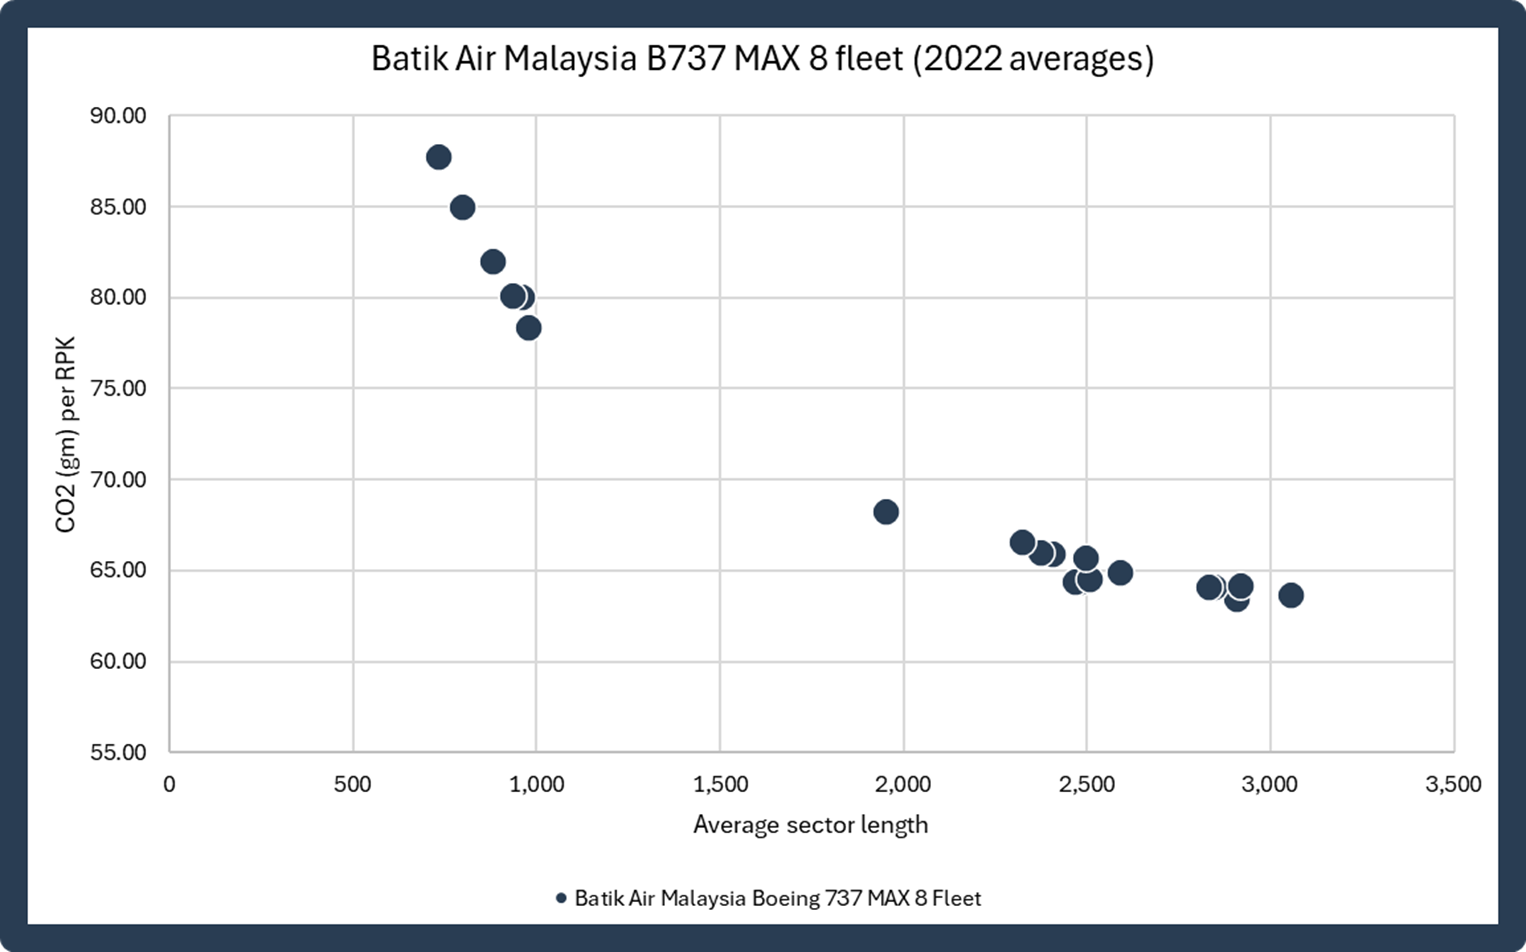
Source: Data powered by PACE
The first group includes aircraft regularly deployed on longer routes to Northeast Asia and Australia, including the now-discontinued world’s longest commercial route for a 737 MAX 8 (Kuala Lumpur to Melbourne, now operated with a layover in Bali). The second group, on the other hand, delivered average sector lengths two-to-three times lower in 2023, operating a greater proportion of shorter hops throughout the Malay Peninsula and into bordering countries.
GOL’s 737 MAX 8s and the 186-seat sweet spot
Much like Batik Air Malaysia, Brazilian LCC Gol Linhas Aereas (GOL) operates its fleet of Boeing 737 MAX 8 aircraft across domestic, regional, and transcontinental flights – in GOL’s case, to the US state of Florida. Across GOL’s fleet of 61 active MAX 8s in 2023, 19 aircraft with average sector lengths in the 2,800 km to 3,600 range achieved notably low emissions intensity: 61 CO2(gm)/RPK on average, compared to a sub-fleet average of 68.21 CO2(gm)/RPK.
GOL operates four seat configurations: 186 seats (53 aircraft), 176 seats (three aircraft), 174 seats (three aircraft) and 168 seats (two aircraft). The three ‘rarer’ lower-density variants feature average load factors on par with the 186-seat MAX 8s, and average sector lengths of 1,284 km, close to the 1,351-km average of the sub-2,800-km 186-seater fleet. However, due to their lower capacity, they are some of the worst-performing aircraft from an emissions intensity perspective in GOL’s MAX 8 fleet.
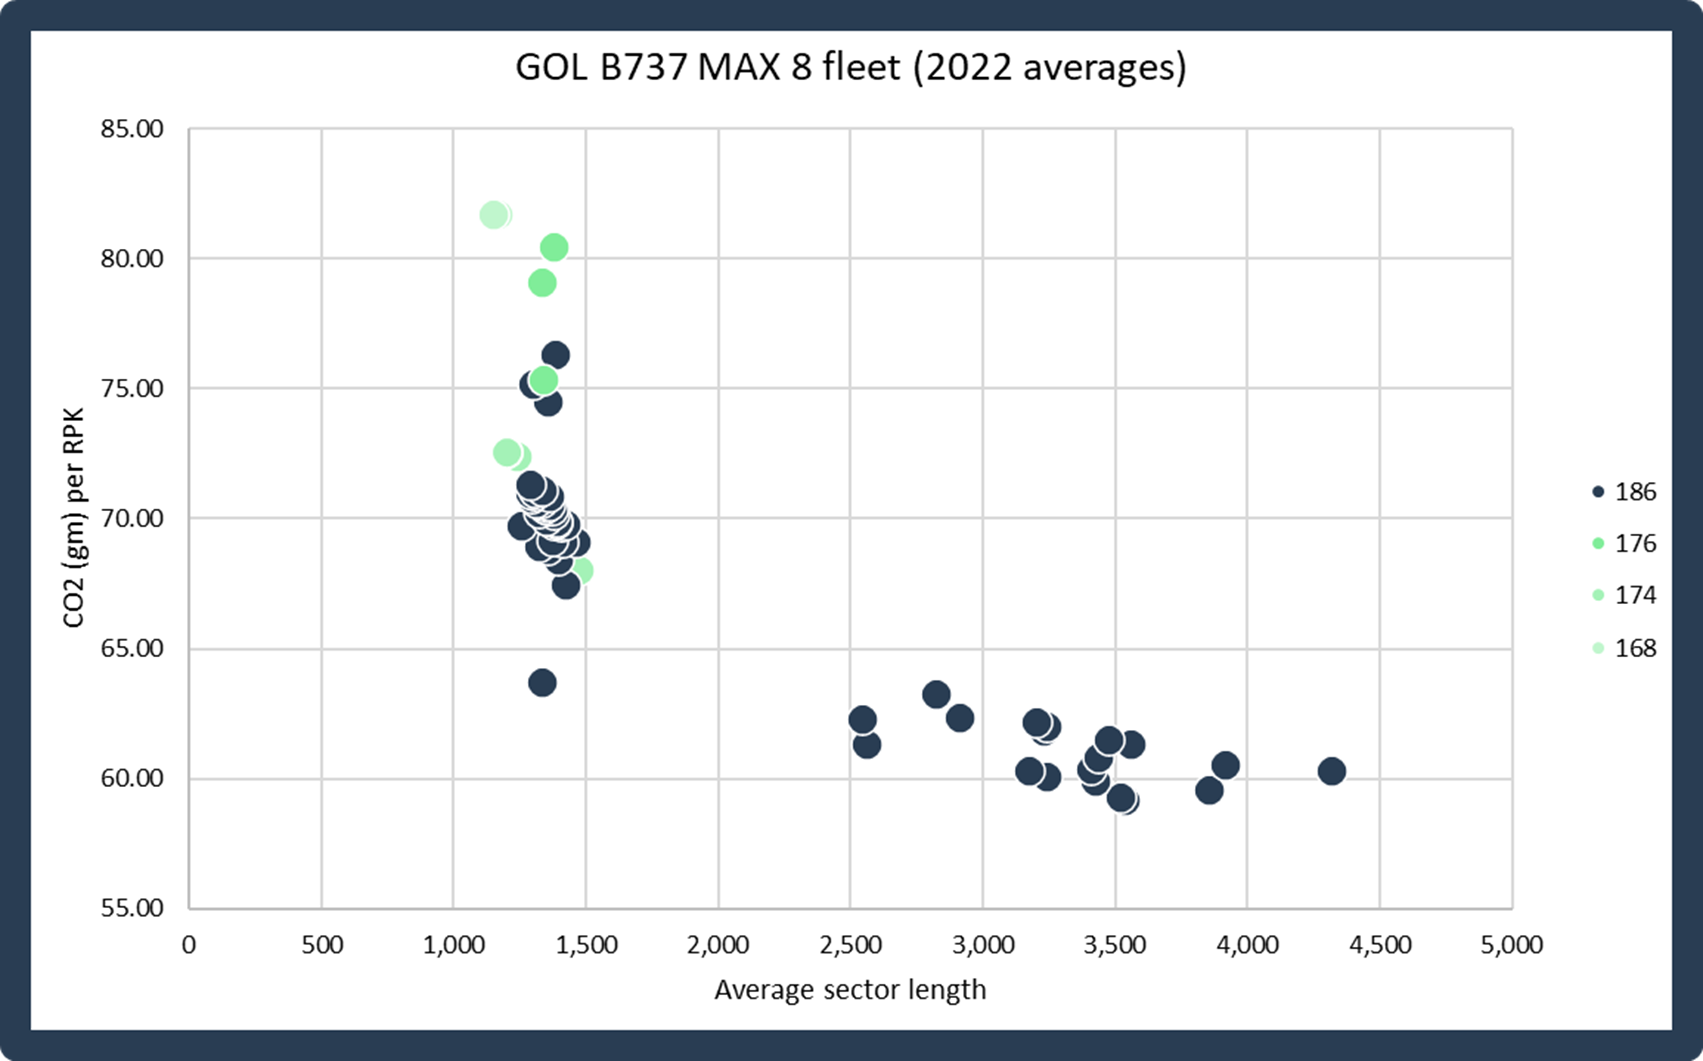 Source: Data powered by PACE
Japanese 787-8s and their all-domestic high carbon intensity
Perhaps the best-known example of aircraft deployment disparities is the Japanese market, where the two leading carriers – All Nippon Airways (ANA) and Japan Airlines (JAL) – have for decades used widebodies between the country’s largest cities. In contrast to GOL, where seat density is highly correlated with lower emissions intensity, the picture for Japan’s Boeing 787-8s looks rather different.
Despite both JAL and ANA operating some of the most seat-dense 787-8s in the world, widebody aircraft simply don’t shine on short-haul deployments from a fuel and emissions standpoint. Most domestic-heavy (<2,000 km average sector length) 787-8s deliver between 135 CO2(gm)/RPK to 160 CO2(gm)/RPK, significantly above the 787-8 type average of 99 CO2(gm)/RPK.
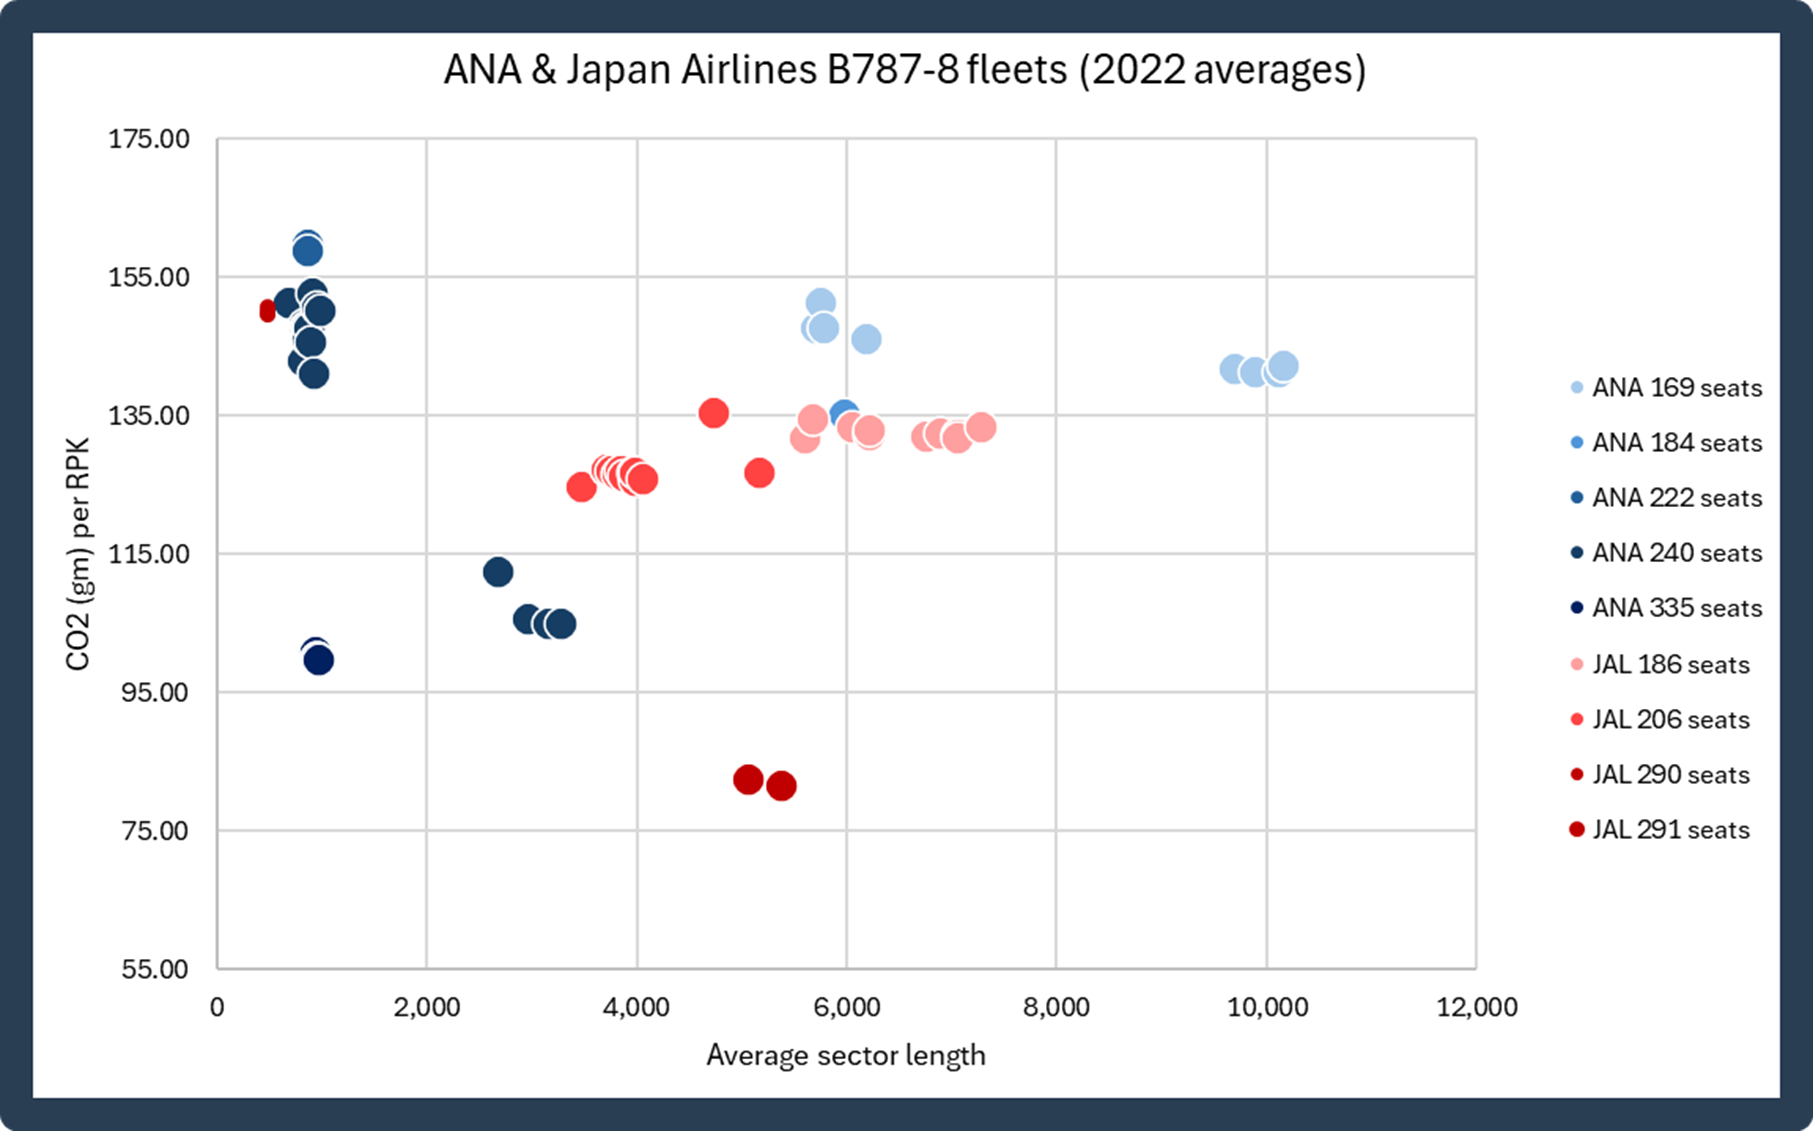 Source: Data powered by PACE
Air France’s B777-300ER 44% emissions intensity gap
Air France’s fleet of long-range Boeing 777-300ER aircraft covers similar average sector lengths between 6,000 km and 8,000 km. And yet, three sub-fleets with different seat configurations deliver vastly different CO2 intensities. Aircraft configured with 468 seats achieve an astonishingly low 87.38 grams of CO2 per RPK, on par with many new generation widebodies. On the other hand, aircraft with more premium cabins achieve CO2 intensities up to 44% higher.
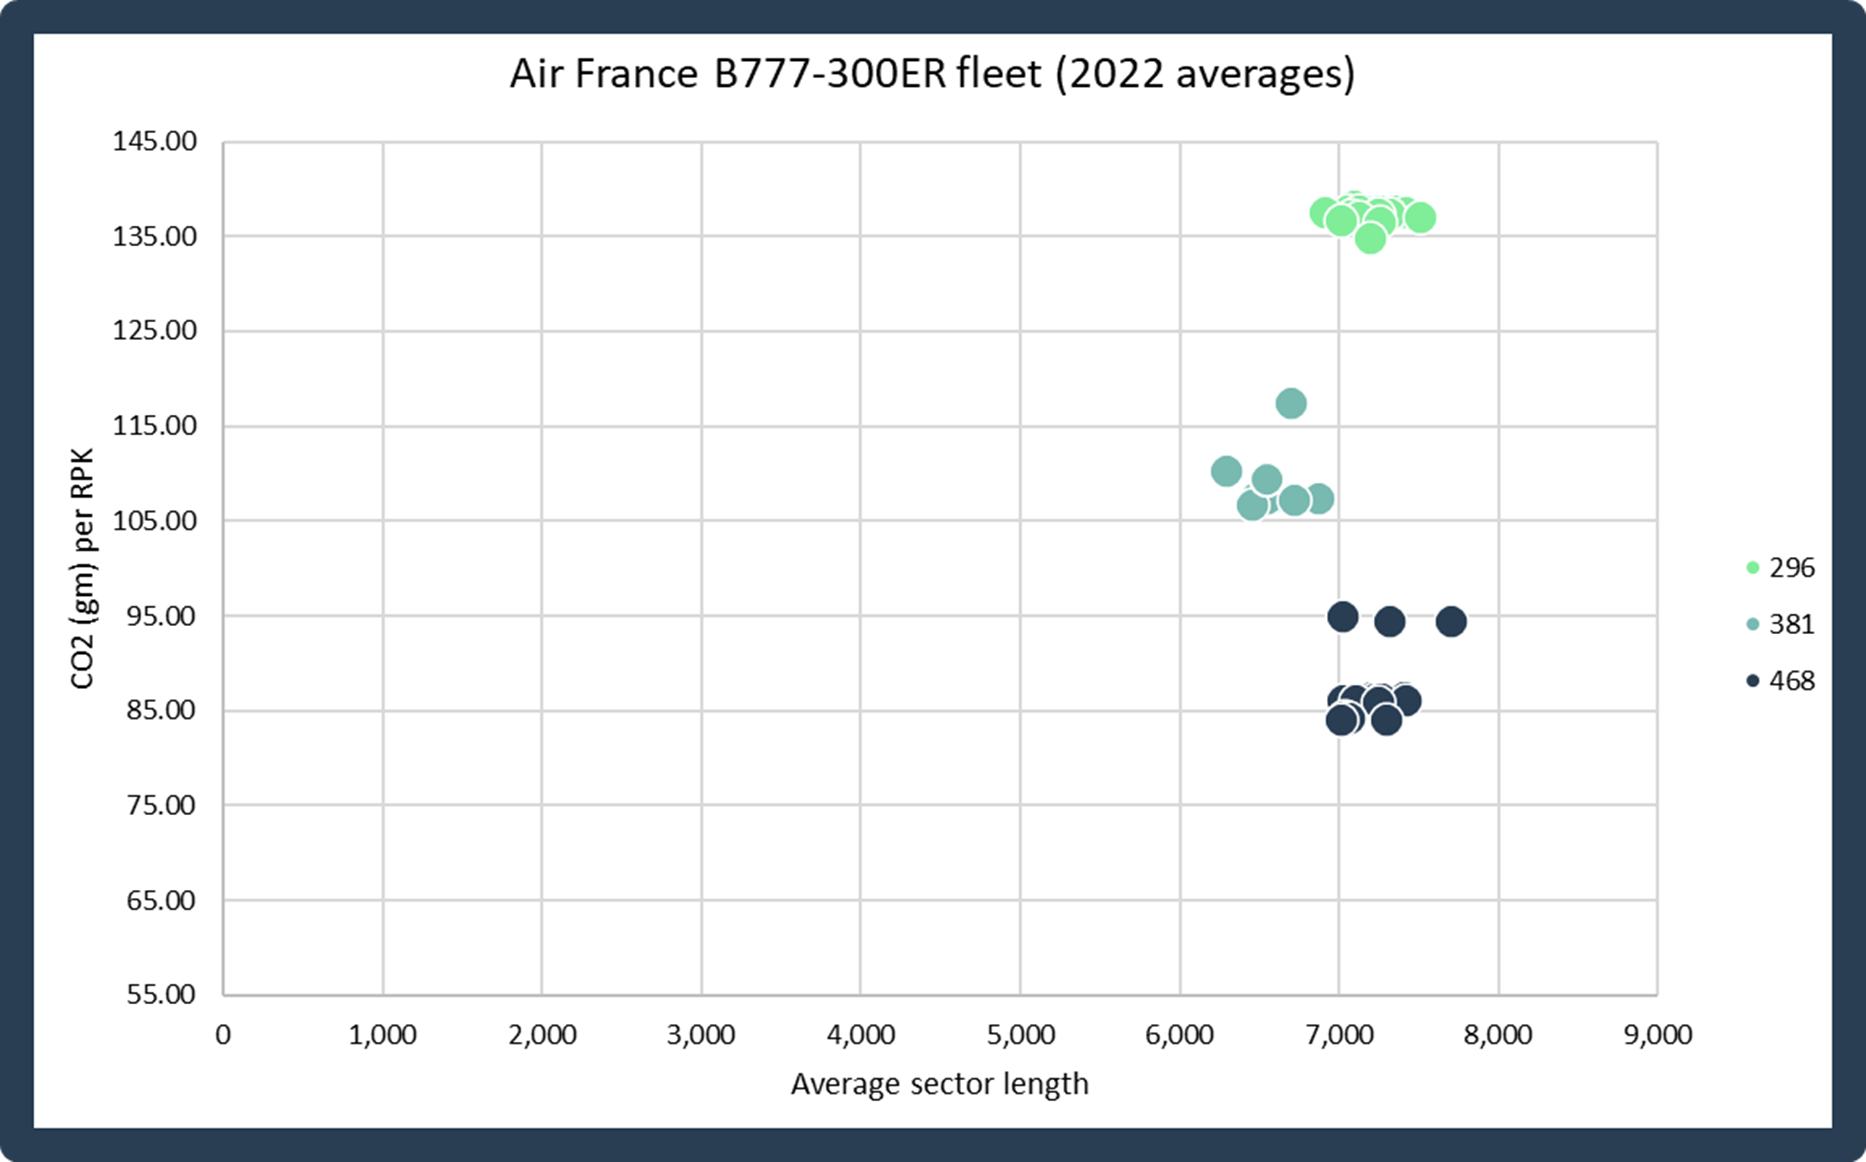
Source: Data powered by PACE
Conclusion
The examples outlined in this analysis underscore that emissions intensity relies on more than just aircraft types or operator business models. There are many scenarios in which denser cabins, higher seat loads, or optimal route deployments can result in emission intensity reductions equal (or higher) to the step change between two generations of aircraft. Historically, asset owners have been particularly cognizant of the impact of high utilisation (and in particular, high cycles) on the economic lives and residual values of an asset. As investors and lenders increasingly benchmark emissions intensity, a balance needs to be struck between technical priorities and non-financial portfolio metrics.
At the same time, prioritising emissions intensity reductions should not lose sight of the commercial realities of airlines and the financial requirements of scaling up SAF usage. Fleets must cater to route diversity and seasonal opportunities for airlines to remain competitive. In some of the examples outlined above, short average sector lengths deliver the feeder traffic that makes longer routes profitable. In other cases, premium capacity delivers higher per-passenger profit margins that make voluntary SAF usage commitments possible.
This is a joint article by Ishka and PACE. To better understand how emissions intensity and other emissions metrics can be analysed please contact the PACE team at customersuccess@pace-esg.com
Join Rob and Eduardo at a breakfast briefing covering the findings of this report during the Ishka ESG: Evolution, Implementation & Disclosure conference in London on 13th March.


Sign in to post a comment. If you don't have an account register here.