Tuesday 25 October 2022

One aircraft, many intensities: Comparing CO2/ASK of new-tech operators
Listen to the article

Aviation sustainability advocates know that the environmental performance of aircraft matters just as much as how they are operated: But what exactly is the emission intensity variance of one aircraft type across multiple operators?
To find out, Ishka analysed data powered by PACE to compare tonnes of CO2/ASK fleet averages across operators of five new-technology narrowbody and widebody types: Airbus A320neo, Airbus A321neo, Boeing 737 MAX 8, Airbus A350-900/1000, and the Boeing 787-8/9.
Born equal, used differently
The carbon intensity of an aircraft measures the amount of t-CO2 emitted per unit of production, generally the Revenue Passengers Kilometers (RPK, paying customers multiplied by distanced travelled) or Available Seat Kilometers (ASK, the total number of seats available). Ishka is focusing on ASK to highlight how seat density and route choices affect the emission intensity of the same aircraft.
The CO2 intensity delta between the analysed aircraft, expressed in tonnes of CO2 per ASK, is on average two times larger for carriers are the bottom versus those at the top. For one aircraft type (the versatile A321neo) it is as large as three times. The key factors in that spread may be:
- Seat configuration. Likewise, the number of passenger seats available on an aircraft varies in relation to the relative payload available after fuel or other cargo. Some airlines may also reduce seat density to accommodate two-, three- and even four-class cabins, in addition to other additional cabin features.
- Cargo. While narrowbody aircraft have limited belly freight capacity, passenger widebody aircraft can accommodate large volumes of cargo. On some routes, cargo profitability may incentivise a lower seat density to stay within maximum takeoff weight (MTOW) limitations.
- Distance. Flying distances approaching the maximum range of an aircraft may result in lower fuel burn efficiency from having to carry that extra fuel. Conversely, short routes minimise time spent at optimum cruise altitudes in relation to takeoff and taxiing. Taxiing, takeoff, and climb burn the highest amount of fuel for a given time or distance in an aircraft.
Another factor not reflected in the data but which also influences the carbon intensity of aircraft on a CO2/ASK basis increases is take-off weight. Heavier airframes and more fuel carried reduces the relative payload available, especially on larger aircraft.
Narrowbodies: A large mix of uses
Scope: The data displayed below covers operators with at least 100 flight cycles for each aircraft type. CO2 emissions, ASKs, and flight cycles cover the operations of each sub-fleet since delivery. Data correct as of 10th October 2022. The data for widebodies combines more than two variants per type to cover a broader range of uses and operators. For a similar reason, only the Boeing 737 MAX 8 is analysed among the 737 MAX type, as this variant covers more than 80% of 737 MAXs delivered and in-service today.
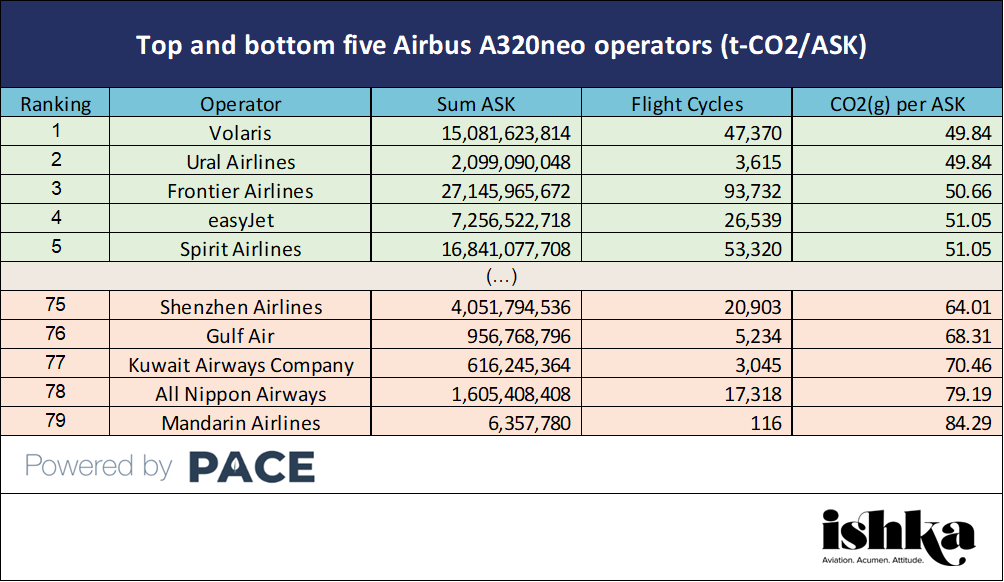
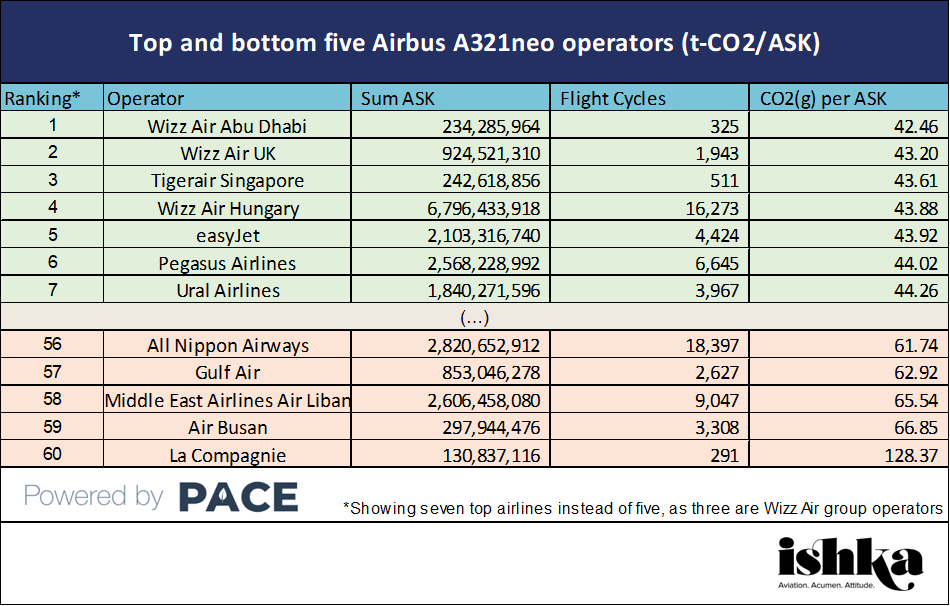
Low-cost carriers dominate the CO2/ASK efficiency rankings for both Airbus narrowbodies, with EasyJet and Ural Airlines featured across both charts. In the case of the A321neo, Wizz Air across their multiple AOCs is a good example of how aircraft with the same high density (239 passengers, just shy of the maximum 244) can have varying emission intensity depending on the routes flown.
Airlines at the bottom of both tables have a variety of reasons for scoring higher averages. For instance, Air Busan operates A321neos with a high-density configuration but a large proportion of their flights cover very short distances from Busan (on the southern part of the Korean peninsula) to nearby Jeju island or to Fukuoka in Japan. Further down – and by some margin – La Compagnie operates a Trans-Atlantic all-business class product. Among A320neos, many at the bottom feature low-density seating, such as Kuwait Airways with only 134 passengers across a two-class configuration (compared to 186 passengers for EasyJet).
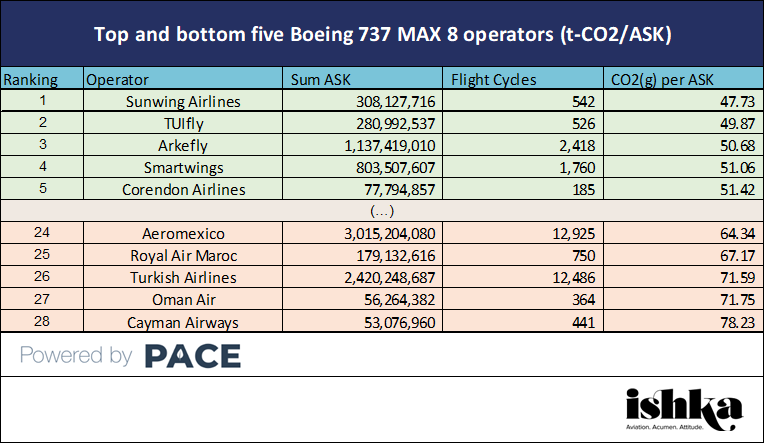
Intensity values for the 737 MAX 8 are broadly similar to those of its direct rival, the Airbus A320neo. Many of the top carriers by emission intensity are leisure airlines operating short-to-medium-haul flights. Conversely, Turkish Airlines or Oman Air offer more complex cabin products with lower seat density.
Widebodies: Density over long distances lead
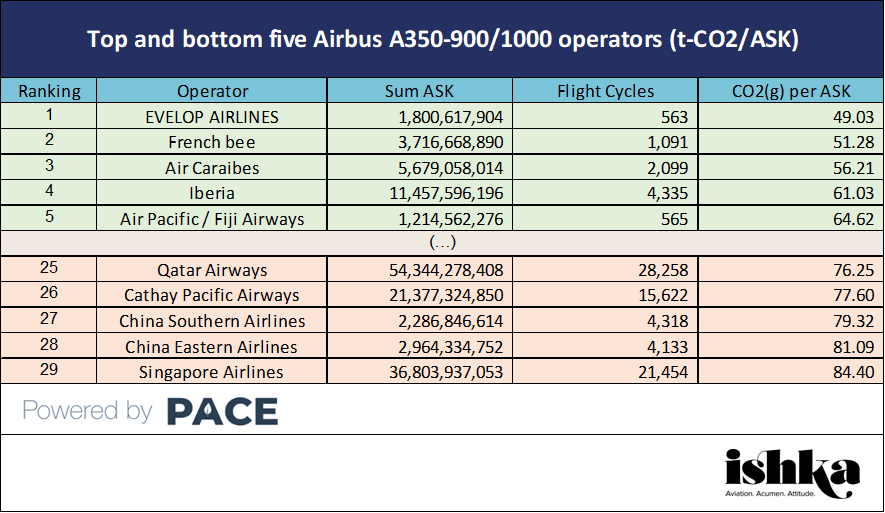
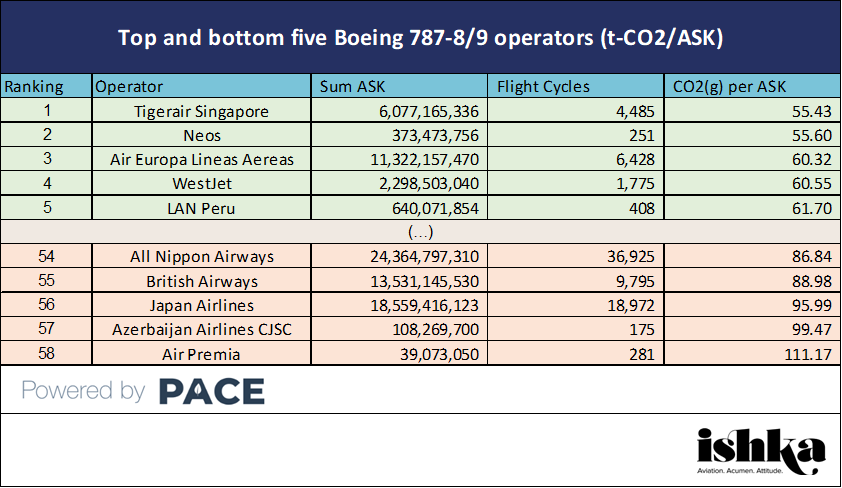
All top carriers across both widebody types share higher-than-average seat density, but several laggards in carbon intensity are also weighed down by shorter flights. All or mostly widebody operators like Singapore Airlines or Cathay Pacific often fly to nearby Asian cities using these aircraft. Singapore Airlines may also be slightly weighed down by its A350-900ULR, which only features business and premium economy seating. Carriers in Japan and China also often fly widebody aircraft domestically. For example, 32% of Japan Airlines flights operated by a Boeing 787-8 are between Tokyo Haneda and Osaka Itami, and 6.5% are between Fukuoka and Tokyo Haneda.
The Ishka View
The purpose of this report is to highlight the emission intensity differences for a given aircraft type across multiple different airlines. Airlines provide different services that cater to different markets across a vast array of geographies and operational constraints. Operators on far-flung islands may inherently cover larger distances across their route network carrying larger proportions of cargo. Other carriers may be focused on providing an air bridge between congested airports, or long-distance flights with thin demand. As a result, ranking airline sub-fleets by carbon intensity per passenger (and not weight units, including cargo) has its limitations.
Nevertheless, Ishka hopes to highlight that fleet replacement by new-technology aircraft is not a one-size-fits-all sustainability solution. Some airlines may still be operating these aircraft in suboptimal ways due to their own preferences or ongoing operational constraints. On a more granular level, airport or airspace congestion can also affect a flight’s carbon intensity. Aircraft ground taxiing is highly inefficient, and the longer an aircraft has to travel from gate to runway the more fuel it will burn. The same can be said for prolonged holding patterns ahead of landing.


Sign in to post a comment. If you don't have an account register here.